Research - Role of Vasoconstriction and Dysregulated Ion Channels in the Protection and Growth of Glioblastoma Multiforme Tumors
Introduction
Glioblastoma multiforme (GBM) is an aggressive grade IV astrocytoma originating in the cerebrum [Hanif et al, 2019]. Over 250,000 cases are diagnosed each year, worldwide. More than 13,000 patients are diagnosed, in the US with over 10,000 deaths. GBM’s prognosis is grim, with patients rarely surviving beyond 15 months after aggressive treatment with surgery, chemotherapy, and radiation therapy. Due to its abnormally rapid development.
Studies show one possible reason for the rapid development is the growth of new blood vessels through a process called Neoangiogenesis. Other studies have proposed that GBM consists of glioma stem cells that are considered resistant to chemotherapy and tumor recurrence. No study has applied a gene expression profiling perspective to explain GBM’s ability to survive chemo drugs or the body’s natural immunity.
Research Question
How are glioma stem cells resistant to chemo drugs or the body’s immune response? In the present paper, I examine biological pathways using gene expression profiling to determine potential reasons for GBM’s resistance. This research may serve as a basis for developing a drug therapy to improve patient outcomes.
Method
Approach: To understand this phenomenon, I compared differentially expressed genes (DEG) from brain samples of GBM patients to those of normal patients. I then used exploratory data analysis to identify the genes that were significantly upregulated in the GBM patients and used those genes to identify the signaling pathways that impact vasoconstriction.
GEO Analysis: I downloaded samples from the NCBI Gene Expression Omnibus (GEO) database. I filtered by the disease name Glioblastoma and species txid9606 (taxonomy for homo sapiens). I then manually filtered the results to include only the samples with expression profiling done through microarray and the data with mRNA and microRNA expressions. I further restricted the sample size to those 20 samples or more. Eight datasets were then selected from this restricted list.
GEO2R data analysis: I then used GEO2R to identify the top DEGs, utilizing the “Define Samples” function to separate the samples into diseased and healthy categories. I used boxplot normalization in the visualization section to examine and remove samples with outliers. In the top DEGs section, I selected the columns for data, namely, p-value, LogFC, Gene Symbol, and Gene Assignments. LogFC was used to measure the degree of gene up or downregulation, where a positive value signifies upregulation and a negative value signifies downregulation. I needed to select both Gene Symbol and Gene Assignments columns because not every dataset had values for both of these columns. I uploaded each dataset into Excel, excluding data with a p-value of less than 0.05, and downloaded it for further processing using R programming.
STRINGDB analysis: I entered a subset (top 500) of these genes into stringDB, a public database of protein interactions, reserving the rest for secondary analysis. This subset was divided into two blocks, one for genes with a positive logFC and the other for a negative logFC. This separation was done to ensure that all aspects of the gene pathway were uniformly enriched or depleted.
Signaling Pathway Identification: I developed another R program to identify those signaling pathways that have direct impact on vasoconstriction. First, a pathway of interest was selected based on literature analysis. Then all the genes from the datasets that were related to the pathway were included using the criteria of average |logFC| greater than 1.1 and p-value less than 0.01. An additional restriction was that the gene must have a consistent regulation (positive or negative) in at least 4 out of eight datasets. With the newly-refined set of genes, the number still matching up with the pathway of interest was counted. If > 50% of the genes in the pathway were valid, the program would automatically mark the pathway as CORRELATION FOUND. Otherwise, the pathway was marked as NO CORRELATION. A box plot chart of the logFC values was also created. The pathways with logFC values showing the least amount of dispersion were selected.
Signaling Pathway Analysis: The pathways identified were then uploaded to STRING to identify the level and significance of upregulation or downregulation. This analysis was then used to describe the relationship between vasoconstriction in GBM to help explain why GBM isresistant to chemo drugs and immune responses
Results
The following 8 datasets were found for GBM : GSE186057, GSE90598, GSE111260, GSE116520, GSE4290, GSE13276, GSE25632, GSE90886. These eight datasets comprised 411 subjects of different ages and backgrounds: 339 tumors and 72 normal (healthy). Figure 1 summarizes the sample datasets used in the analysis.
Out of the eight datasets, three samples included ages for each individual, five samples listed gender and one sample listed the tumor size.
Figure 2 shows the volcano plots for each sample. A volcano plot shows the relationship between the p-values of a statistical test and the magnitude of the difference in expression values of the samples with the distribution of upregulated and downregulated DEGs displayed as points on the graph. The volcano plots show that the samples from GBM patients have many statistically significant differentially expressed genes as compared to those from the normal samples.
A bar graph depicting the overall distribution of logFC values is shown in Figure 3. The graph shows a bimodal relationship with two peaks: one for upregulated and the other for downregulated genes. The mean |logFC| value was 1.937961 and the median was 1.71595. Tukey’s (1.5 IQR) rule showed that a total of 3 genes were mild outliers, and eight genes were extreme outliers. However, these outliers were not significant enough to eliminate any genes from this research.
Out of the top 500 genes entered in StringDB, the positively-regulated block contained 200 genes, while the negative one contained 300. Far more connections were identified in the negative block than in the positive one, with interactions mainly co-expression or text-mining derived. Interestingly, the positive group held two distinct clusters of genes with various functions

Figure 1: Summary Metrics of each of the 8 datasets
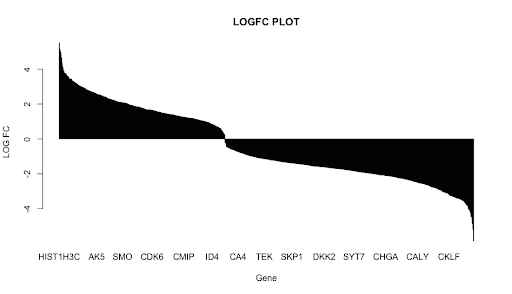
Figure 3: A bar chart shows the logFC values of all the genes in the dataset

Figure 2: Volcano Plots. Red is upregulated, blue downregulated.
Signaling Pathway Identification: Studies have established that the cellular microenvironment of the blood-brain barrier, which includes the endothelial cells (ECs), pericytes, and vascular smooth muscle cells (VSMCs), regulate the blood flow through vasodilation. Vasodilation has several means of occurring, each supported by a distinct pathway. As long as one of these pathways remains unaffected, vasodilation will still occur [Somlyo AV, 1995]. When vasodilation is prevented, arterioles begin to constrict, limiting the capillary beds that receive blood. Most blood will flow toward the tumor if the tumor can constrict the arteriole nearby [Chen K et al, 2007]. Following is a discussion on some of these pathways.
Vasodilation depends upon the relaxation of the VSMCs lining the arterioles. The cross-bridge cycling of two fibers (myosin and actin) can be prevented by the phosphorylation of MLCK (myosin light-chain kinase). This enzyme adds a phosphate group to the rMLC domain of a myosin filament [Walsh MP, et al, 1983]. There are a few ways to achieve this.
The nitric oxide pathway begins with an increase in Ca2+ concentration within an EC. These Ca2+ ions bind to a protein called Apo-CaM (Apo-calmodulin), turning it into a Ca2+-CaM (calcium-calmodulin) complex [Ignarro, 2014]. Endothelial nitric oxide synthase (eNOS) is activated by this complex. The eNOS acts like an electron transport chain, allowing nitrogen to bind to an oxygen atom to create nitric oxide (NO) [Strielkov IV, et al, 2013]. NO is a small molecule, allowing it to quickly diffuse through the capillary to a VSMC, where it binds to an SGC (soluble guanylate cyclase) enzyme. The SGC produces cGMP (cyclic GMP), a molecule that activates an enzyme called PKG (protein kinase G). PKG can phosphorylate MLCK, preventing the VSMC from contracting [Sassone-Corsi P, et al, 2012].
A parallel pathway is that of prostacyclin. It starts with activating a phospholipase enzyme under high Ca2+ concentration and the catalyzation of a unique phospholipid called phosphatidylcholine (PC), otherwise known as lecithin [Francis SH, et. al, 2010]. This reaction produces arachidonic acid (AA), an essential ingredient in many vasodilation pathways. The AA is converted into PGI2 via the prostacyclin synthase reaction. PGI2 is also a small molecule and can travel to the membrane of VSMCs and interact with an IP GPCR. The heterotrimeric G protein used here sends a GTP molecule which activates an adenylyl cyclase transmembrane enzyme, which converts the GTP into cAMP (cyclic AMP) [Garland CJ, et. al, 2016]. The cAMP works similarly to the cGMP in the NO pathway and binds to a PKG (protein kinase G) enzyme to phosphorylate MLCK [Garland CJ, et. al, 2016].
Another pathway includes the endothelial-dependent hyperpolarization factor (EDHF). This pathway starts the same as the prostacyclin pathway. However, it differs in what is done with the AA. Instead of going through the prostacyclin synthase reaction, CYP (cytochrome P450) enzymes turn it into an EET (epoxyeicosatrienoic acid) [Cohen RA, et. al, 1995]. These EETs travel to the K+ channels of VSMCs, blocking them and causing the hyperpolarization of the intracellular space, which prevents cross-bridge cycling due to the resulting decrease in calcium concentration within the cell.
There are many other pathways for vasodilation. However, they all seem to have something in common: they begin only under high [Ca2+ ] levels within the endothelial cell.
Calcium concentration increases within endothelial cells due to various factors, including hemodynamic shear stress and classical IP3/RyR signaling [Malek AM.et al, 1999]. However, one stood out.Ca2+ ions could diffuse across the gap junction between astrocytes and endothelial cells, thereby supplying the ECs with a constant flow of calcium [Bennett MVL, et al, 2003]. This finding means that if astrocytes cannot release Ca2+, the vasoconstriction will increase, consequently allowing the tumor to receive more blood.
Interestingly, many pathways related to regulating calcium homeostasis within the tumor cell showed up on STRING. However, another set of tests was done to ensure that critical pathways were not missed in the initial subset.

Figure 4

Figure 5
A literary analysis of calcium signaling was conducted to determine what factors regulate the Ca2+ ion. After developing a set of pathways to analyze, the corresponding genes were derived using the Alliance of Genome Resources database.
Signaling Pathway Analysis: genes that resulted from the filter rules as described in the Methods section are shown in Figure 4. Among the 20 pathways selected, only three showed any correlation. These were the GABA receptor, the n-type voltage-gated calcium channel (n-VGCC), and the NMDA receptor. Figure 5 shows the boxplot of the logFC values of the pathways that were identified as significantly correlated in the table above. GABA, n-VGCC and NMDA receptors were found to have low levels of dispersion in the dataset.
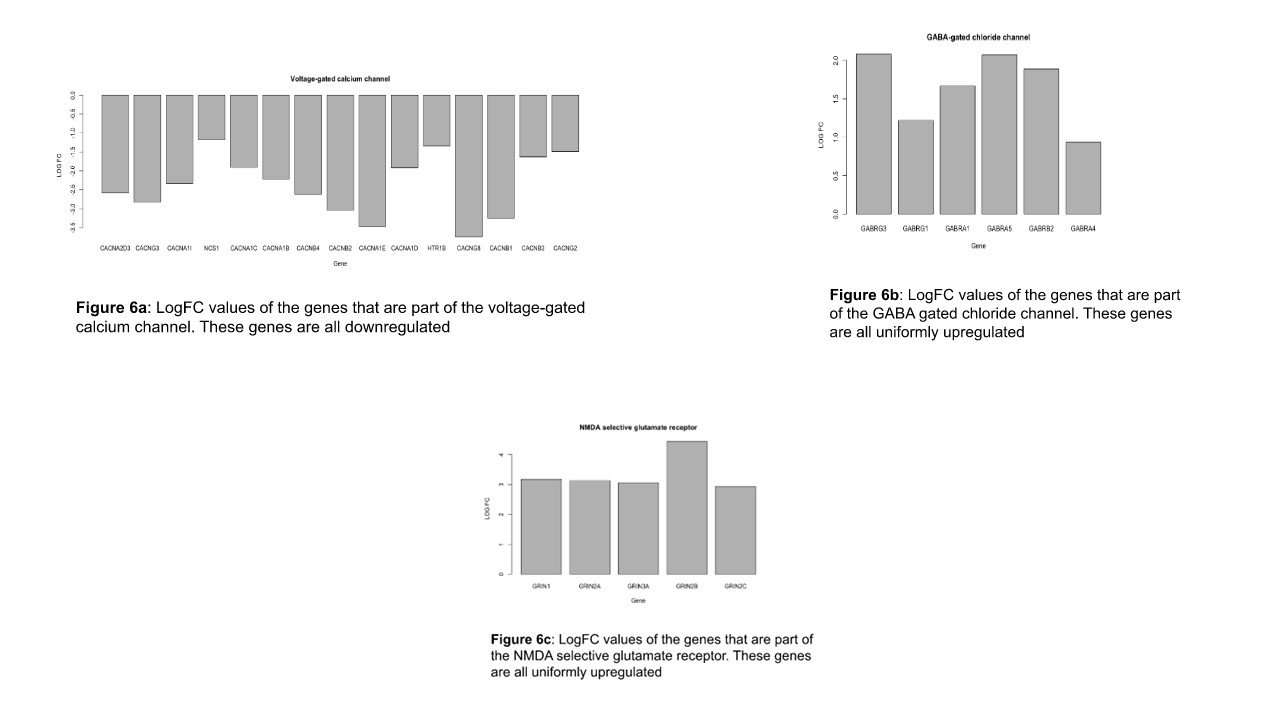
Figure 6a shows the significant logFC values of the genes in the VGCCs pathway across all the datasets. The figure shows that all these genes are downregulated with a STRING strength of 1.45.
Figure 6b shows the significant logFC values of the genes that are involved in the GABA gated chloride channel across all the datasets. The figure shows that all these genes are uniformly upregulated with a strength of 1.66 on the STRING database.
Figure 6c shows the significant logFC values of the genes that are involved in the NMDA selective glutamate receptor across all the datasets. The figure shows that all these genes are uniformly downregulated with a 1.38 STRING strength.

Figure 7
Discussion
Impact of downregulation of n-VGCC: GABA (γ-butyric acid), a nonprotein amino acid, is often called the most significant inhibitory neurotransmitter in the brain [Jewett BE, et al, 2020]. Its most common receptor type, GABAA, has a classic pentameric Cys-loop structure that binds GABA molecules. The presence of GABA causes the GABAA to open [Goetz T, et al, 2007]. Since the chloride [Cl-] concentration outside the cell is much higher than inside (110 mM compared to 4 mM), a heavy stream of anions will enter the cell, drastically dropping the electrical potential gradient [Ormond J, et al]. This hyperpolarization is called an Inhibitory Postynaptic Current or IPSC. The purpose of GABA receptors is to counterbalance the Excitatory Postsynaptic Currents produced by cation channels [Karakas E, et al, 2015]. However, as we can see from the results, GABA receptors are uniformly upregulated. This dysregulation could cause an over-inhibition of many ion channels, most importantly those heavily involved with calcium homeostasis, like the voltage-gated calcium channel (VGCC). Such a change could lead to the decreased calcium diffusion needed for vasoconstriction.
Impact of upregulation of NMDAR: NMDA receptors (NMDARs) are a type of ionotropic Glutamate Receptor that is most notably involved in long-term potentiation (otherwise known as memory). NMDARs are di-heterotetrameric, with a pore-forming subunit in the center [Xin WK, et al, 2005]. This pore is blocked by an Mg2+ ion in the inactive state. In depolarized intracellular fluid, the magnesium ion leaves the space since it is no longer drawn to the less negatively charged area. The NMDAR must bind glycine and glutamate to open and take in K+, Na+, and Ca2+ ions. These ions will further depolarize the cytoplasm, causing an increased VGCC effect [Nik Nabil WN. et al, 2021]. However, according to the analysis, NMDA receptors are downregulated. If fewer cations enter the cell, it may become more challenging for the n-VGCCs to sustain a sparklet. Therefore, less calcium will leave the ER. With these three factors combined (GABAR enrichment, VGCC and NMDAR depletion), GBM astrocytes will not be able to secrete enough calcium to support vasodilation of arterioles, allowing blood to be directed towards the neoplasm.
Impact of vasoconstriction: Figure 7 shows how the dysfunction of genes may impact vasoconstriction. One repercussion of vasoconstriction may be the apparent arrest of leukocyte migration. Early in the progression of tumor development, cancer cells that have not yet entered quiescence will have immune responses taken against their neo-antigens [Hernandez, 2016], likely from damage-associated molecular patterns caused by necrosis [Zhang, et al, 2007]. First, sentinel cells like dendritic cells and mast cells will release pro-inflammatory mediators like histamine, TNFɑ, interleukins, and prostaglandins [Valentijn. et al, 2011]. H1 GPCRs on the basolateral surface of ECs will bind histamine, triggering a process called endothelial contraction. During endothelial contraction, endothelial cells slide apart to allow leukocytes to pass. Weibel-Palade bodies will deposit selectins (such as P and E-selectins) on their endothelial plasma membrane to foster the first step of leukocyte extravasation, rolling.
However, for leukocytes to even reach the site of the immune response, blood vessels need to dilate sufficiently for the cells to reach their destination easily. Without this, very few immune cells will enter the site of inflammation [Bio-Rad. Understanding Immuno-oncology]. The few that do manage will be subjected to additional obstacles. Studies have shown that minimal leukocyte exposure can often help tumors reach quiescence faster [Ti D, et al, 2022]. Leukocytes may be able to eliminate a few immunogenic tumor cells, but in doing so, they neglect a more dangerous population: those that don’t trigger immune responses. Over time, the neoplasm will grow increasingly difficult for immune cells to detect [Wherry EJ,et al, 2015]. A further complication may be the decline in the productivity of CD8+ T-cells after prolonged cytokine exposure. This state is commonly known as T-cell exhaustion and occurs due to changes in metabolism and expression of inhibitory receptors, the most famous of which is the Programmed Death 1 receptor [Wu CX, et al, 2015]. Furthermore, blockages may be another layer of defense against drug-based treatment.
There are extensive clinical observations that demonstrate hallmarks of vasoconstriction, although they haven’t yet been explicitly identified. For instance, glioma-related edema has often been a biomarker of poor prognosis [Lin ZX, et al, 2013]. However, it is with vasoconstriction that we see why this may be the case. As observed in situations of stroke-related ischemia, the increased intravascular pressure causes fluid to exit the vasculature. This, coupled with the acute endothelial contraction from inflammation could allow the accumulation of fluids outside the vessels [Zoccarato M,et al, 2021]. Furthermore, GBM neoplasms have recently been found to harbor a significant amount of Vesiculo-Vacuolar organelles within their caveolae, which may aid in increased diffusion and the formation of peritumoral blockage edema [Noch E,et al, 2009].
Another manifestation of vasoconstriction comes from the development of necroses (or necrotic niches) in GBM tumors. This is usually due to a thrombus at the center of the tumor, or circumscribed pseudopalisading. Due to the production of VEGF and the formation of glomeruloid bodies (because of the activation of Tie2 RTKs), an influx of HIF1 transcription factors tends to collect around the tumor [Zagzag et al, 2000]. This has also been experimentally verified [Yee et al, 2020]. HIF1 is a regulator of Fe2+ homeostasis, so many tumor cells enter programmed ferroptosis and die by ROS (reactive oxygen species) molecules due to the increased intracellular iron concentration [Yee et al, 2020]. Although it may seem counterintuitive, necrosis may prove beneficial for tumors, as necrotic niches house glial stem cells (GSCs) [Yang et al, 2017]. Necrotic cells release chemotactic cytokines called alarmins, which have been shown to foster the spread of cancer due to their ability to cause taxis in GSCs [Papale et al, 2020].
Lastly, the GBM neoplasm has the potential to capitalize upon post-ischemic reconstruction. Reactive astrocytes and Gemistocytes (reactive astrocytes with an increased cytoplasmic volume) participate in the revitalization process and may be closely involved with the tumor [Liddelow, et al, 2017]. Reactive astrocytes provide a defense against ROS molecules and aid in neoangiogenesis by releasing VEGF and glial-cell neurotrophic factor (GDNF), which has been shown to revive damaged cells. These neurorestorative processes, observed in other cancers, may also benefit GBM.
Limitations and strengths
Comparison of the genes found in the datasets was weakened by the assumption that all LogFCs held equivalent weightage in that LogFCs were not used in analysis after initial restrictions and assortment into upregulation or downregulation. Essentially, all genes were assumed to be equally expressed. However, because of this, it is possible that important genes with greater LogFC values were overshadowed by less important genes that were, by chance, part of a common pathway. Since this research used existing publicly available datasets, it was not possible to completely control for confounding variables such as race, gender, tumor size, disease progression and treatment used. The strength of this research should also be recognized. Data analysis was done using 8 datasets, which made it possible to identify genes common to more than one dataset. This also allowed for the finding of statistically significant genes. Moreover, the analysis used stricter p-values (< 0.01), yielding stronger correlation rather than being based on chance
Future Studies
Future research should address the limitations of the study. Weighted analysis of the genes could be carried out by attaching logFC values to the genes rather than assuming that they are equivalent. Further analysis needs to be done on the function of astrocytes in vasoconstriction. This can be done via both gene expression analysis and image processing. Research is also needed to elaborate on the etiological effects of medication on the calcium signaling pathways.
Conclusion
This study suggests that the ion channels and vasoconstriction are deeply involved in a GBM tumor’s resistance to immune and drug-related treatments. The research found three pathways that may be dysregulated in GBM patients and possibly be involved in vasoconstriction. However, with the isolation of the various constituents of vasoconstriction as described in this paper, the possibility of weakening glioblastoma no longer remains distant.